|
数据搜索系统,热门电子元器件搜索 |
|
|
数据搜索系统,热门电子元器件搜索 |
|
AD8317ACPZ-R7 数据表(PDF) 12 Page - Analog Devices |
|
|
|||||||||||||||||||||||||||||
AD8317ACPZ-R7 数据表(HTML) 12 Page - Analog Devices |
|
|
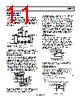
12 / 19 page  AD8317 Data Sheet Rev. C | Page 12 of 19 The slope is given by −ID × 2x × 1.5 kΩ = −22 mV/dB × x For example, if a resistor divider to ground is used to generate a VSET voltage of VOUT/2, x = 2. The slope is set to −880 V/decade or −44 mV/dB. TEMPERATURE COMPENSATION OF OUTPUT VOLTAGE The primary component of the variation in VOUT vs. temperature, as the input signal amplitude is held constant, is the drift of the intercept. This drift is also a weak function of the input signal frequency; therefore, provision is made for the optimization of internal temperature compensation at a given frequency by providing Pin TADJ. COMM COMM ICOMP VINTERNAL TADJ RTADJ 1.5k Ω AD8317 Figure 26. TADJ Interface RTADJ is connected between TADJ and ground. The value of this resistor partially determines the magnitude of an analog correction coefficient, which is used to reduce intercept drift. The relationship between output temperature drift and frequency is not linear and cannot be easily modeled. As a result, experimentation is required to choose the correct TADJ resistor. Table 4 shows the recommended values for some commonly used frequencies. Table 4. Recommended RTADJ Values Frequency Recommended RTADJ 50 MHz 18 kΩ 100 MHz 18 kΩ 900 MHz 18 kΩ 1.8 GHz 8 kΩ 1.9 GHz 8 kΩ 2.2 GHz 8 kΩ 3.6 GHz 8 kΩ 5.3 GHZ 500 Ω 5.8 GHz 500 Ω 8 GHz Open MEASUREMENT MODE When the VOUT voltage or a portion of the VOUT voltage is fed back to the VSET pin, the device operates in measurement mode. As seen in Figure 27, the AD8317 has an offset voltage, a negative slope, and a VOUT measurement intercept at the high end of its input signal range. 0 0.25 0.50 0.75 1.00 1.25 1.50 2.00 –1.5 –1.0 –0.5 0 0.5 1.0 1.5 2.0 –60 –55 –50 –45 –40 –35 –30 –25 –20 –15 –10 –5 0 5 10 15 PIN (dBm) RANGE FOR CALCULATION OF SLOPE AND INTERCEPT VOUT IDEAL VOUT 25°C ERROR 25°C 1.75 INTERCEPT Figure 27. Typical Output Voltage vs. Input Signal The output voltage vs. input signal voltage of the AD8317 is linear-in-dB over a multidecade range. The equation for this function is VOUT = X × VSLOPE/DEC × log10(VIN/VINTERCEPT) (3) = X × VSLOPE/dB × 20 × log10(VIN/VINTERCEPT) (4) where: X is the feedback factor in VSET = VOUT/X. VSLOPE/DEC is nominally −440 mV/decade, or −22 mV/dB. VINTERCEPT is the x-axis intercept of the linear-in-dB portion of the VOUT vs. PIN curve (see Figure 27). VINTERCEPT is 2 dBV for a sinusoidal input signal. An offset voltage, VOFFSET, of 0.35 V is internally added to the detector signal, so that the minimum value for VOUT is X × VOFFSET; therefore, for X = 1, the minimum VOUT is 0.35 V. The slope is very stable vs. process and temperature variation. When base-10 logarithms are used, VSLOPE/DECADE represents the volts/decade. A decade corresponds to 20 dB; VSLOPE/DECADE/20 = VSLOPE/dB represents the slope in volts/dB. As noted in Equation 3 and Equation 4, the VOUT voltage has a negative slope. This is also the correct slope polarity to control the gain of many power amplifiers in a negative feedback con- figuration. Because both the slope and intercept vary slightly with frequency, it is recommended to refer to the Specifications section for application-specific values for slope and intercept. Although demodulating log amps respond to input signal voltage, not input signal power, it is customary to discuss the amplitude of high frequency signals in terms of power. In this case, the characteristic impedance of the system, Z0, must be known to convert voltages to their corresponding power levels. The following equations are used to perform this conversion: P [dBm] = 10 × log10(VRMS2/(Z0 × 1 mW)) (5) P [dBV] = 20 × log10(VRMS/1 VRMS) (6) P [dBm] = P [dBV] − 10 × log10(Z0 × 1 mW/1 VRMS2) (7) |
|
|
链接网址 |
| ALLDATASHEET是否为您带来帮助? [ DONATE ] |
关于 Alldatasheet | 广告服务 | 联系我们 | 隐私政策 | 数据表链接 | 链接交换 | 制造商名单 All Rights Reserved©Alldatasheet.com |
| Russian : Alldatasheetru.com | Korean : Alldatasheet.co.kr | Spanish : Alldatasheet.es | French : Alldatasheet.fr | Italian : Alldatasheetit.com Portuguese : Alldatasheetpt.com | Polish : Alldatasheet.pl | Vietnamese : Alldatasheet.vn Indian : Alldatasheet.in | Mexican : Alldatasheet.com.mx | British : Alldatasheet.co.uk | New Zealand : Alldatasheet.co.nz |
|
Family Site : ic2ic.com |
icmetro.com |
 Chinese ▼
 English
 Chinese
 German
 Japanese
 Russian
 Korean
 Spanish
 French
 Italian
 Portuguese
 Polish
 Vietnamese
 Indian
 Mexican
 British
 New Zealand