|
数据搜索系统,热门电子元器件搜索 |
|
|
数据搜索系统,热门电子元器件搜索 |
|
TC236PA 数据表(PDF) 11 Page - Texas Instruments |
|
|
|||||||||||||||||||||||||||||
TC236PA 数据表(HTML) 11 Page - Texas Instruments |
|
|
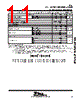
11 / 15 page  TC236 680- × 500-PIXEL CCD IMAGE SENSOR SOCS043A – JUNE 1994 – REVISED NOVEMBER 1994 11 POST OFFICE BOX 655303 • DALLAS, TEXAS 75265 electrical characteristics over recommended operating range of supply voltage, TA = –10°C to 45°C PARAMETER MIN TYP† MAX UNIT Dynamic range (see Note 2) With CDS‡ 68 69 70 dB Dynamic range (see Note 2) Without CDS‡ 57 58 59 dB Charge conversion factor 20 µV/e Charge-transfer efficiency (see Note 3) 0.9999 0.99995 1 Signal-response delay time, τ (see Note 4) TBD ns Gamma (see Note 5) 1 Output resistance 300 400 500 Ω Noise equivalent signal With CDS‡ 8.5 10 12 electrons Noise-equivalent signal Without CDS‡ 30 36 42 electrons ADB (see Note 6) TBD Rejection ratio SRG (see Note 7) TBD dB ABG (see Note 8) TBD Supply current 5 10 mA IAG1, IAG2 2000 Input capacitance Ci SRG 70 pF Input capacitance, Ci RST 10 pF SAG 4000 † All typical values are at TA = 25°C. ‡ CDS = Correlated double sampling, a signal-processing technique that improves noise performance by subtraction of reset noise. NOTES: 2. Dynamic range is – 20 times the logarithm of the mean noise signal divided by saturation output signal. 3. Charge-transfer efficiency is one minus the charge loss per transfer in the output register. The test is performed in the dark using an electrical input signal. 4. Signal-response delay time is the time between the falling edge of the SRG pulse and the output-signal valid state. 5. Gamma ( γ) is the value of the exponent is the equation below for two points on the linear portion of the transfer-function curve (this value represents points near saturation). Exposure (2) Exposure (1) g + Output signal (2) Output signal (1) 6. ADB rejection ratio is – 20 times the logarithm of the ac amplitude at the output divided b the ac amplitude at ADB. 7. SRG rejection ratio is – 20 times the logarithm of the ac amplitude at the output divided by the ac amplitude at SRG. 8. ABG rejection ratio is – 20 times the logarithm of the ac amplitude at the output divided by the ac amplitude at ABG. |
|
|
链接网址 |
| ALLDATASHEET是否为您带来帮助? [ DONATE ] |
关于 Alldatasheet | 广告服务 | 联系我们 | 隐私政策 | 数据表链接 | 链接交换 | 制造商名单 All Rights Reserved©Alldatasheet.com |
| Russian : Alldatasheetru.com | Korean : Alldatasheet.co.kr | Spanish : Alldatasheet.es | French : Alldatasheet.fr | Italian : Alldatasheetit.com Portuguese : Alldatasheetpt.com | Polish : Alldatasheet.pl | Vietnamese : Alldatasheet.vn Indian : Alldatasheet.in | Mexican : Alldatasheet.com.mx | British : Alldatasheet.co.uk | New Zealand : Alldatasheet.co.nz |
|
Family Site : ic2ic.com |
icmetro.com |
 Chinese ▼
 English
 Chinese
 German
 Japanese
 Russian
 Korean
 Spanish
 French
 Italian
 Portuguese
 Polish
 Vietnamese
 Indian
 Mexican
 British
 New Zealand