|
数据搜索系统,热门电子元器件搜索 |
|
|
数据搜索系统,热门电子元器件搜索 |
|
ADA4870ACPZ-R7 数据表(PDF) 20 Page - Analog Devices |
|
|
|||||||||||||||||||||||||||||
ADA4870ACPZ-R7 数据表(HTML) 20 Page - Analog Devices |
|
|
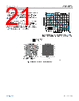
20 / 24 page  Data Sheet ADA4870 APPLICATIONS INFORMATION analog.com Rev. B | 20 of 24 Figure 71. Small Signal Bandwidth for Various CL and RS Values from Figure 70 HEAT AND THERMAL MANAGEMENT High output current amplifiers like the ADA4870 generate heat, instantaneous or continuous, depending on the signal being proc- essed. Properly applied thermal management techniques move heat away from the ADA4870 die and help to maintain acceptable junction temperatures (TJ). A highly conductive thermal path from the exposed pad of the LFCSP package to the ambient air is required to obtain the best performance at the lowest TJ. POWER DISSIPATION The first step in identifying a thermal solution is to compute the power generated in the amplifier during normal operation. The schematic in Figure 72 shows a simplified output stage of the ADA4870. The most significant heat is generated by the output stage push-pull pair, particularly when driving heavy loads. Figure 72. Simplified Output Stage The total power dissipation in the amplifier is the sum of the power dissipated in the output stage plus the quiescent power. The average power for an amplifier processing sine signals is computed by Equation 1. Equation 2 can be used to compute the peak power of a sine wave and can be used to compute the continuous power dissipation of dc output voltages where VPEAK is the dc load voltage. These equations assume symmetrical supplies and a load referred to midsupply. PAVG,SINE= VS×Iq + 2π×VCCVPEAK RL – VPEAK22RL (1) PPEAK= VS×Iq + VCC– VPEAK × VPEAKRL (2) where: VS is the total supply voltage (VCC – VEE). Iq is the amplifier quiescent current. A graphical representation of the PAVG, SINE and PPEAK power equations is shown in Figure 73. The power curves were generated for the ADA4870 operating from ±20 V supplies and driving a 20 Ω load. The quiescent power intersects the vertical axis at ~1.3 W when VOUT is at 0 V or midsupply. The graphs stop at the output swing limit of 18 V. For dc analysis, peak power dissipation occurs at VOUT = VCC/2, while the maximum average power for sine wave signals occurs at VOUT = 2VCC/π. Figure 73. Average Sine and Peak Power vs. VOUT, VS = ±20 V, RL = 20 Ω SAFE OPERATING AREA The safe operating area (SOA) is a curve of output current vs. out- put stage collector-emitter voltage (VCE), under which the amplifier can operate at a safe junction temperature (TJ). The area under the curves of Figure 74 shows the operational boundaries of the ADA4870 for the PCB of Figure 75 that maintains a TJ ≤ 140°C. The SOA curves of Figure 74 are unique to the conditions under which they were developed, such as PCB, heat sink, and ambient temperature. Wakefield-Vette 518-95AB heat sink was used in the evaluation. It was assembled to the PCB using GC Electronics 10-8109 Type Z9 thermal interface material. |
|
|
链接网址 |
| ALLDATASHEET是否为您带来帮助? [ DONATE ] |
关于 Alldatasheet | 广告服务 | 联系我们 | 隐私政策 | 数据表链接 | 链接交换 | 制造商名单 All Rights Reserved©Alldatasheet.com |
| Russian : Alldatasheetru.com | Korean : Alldatasheet.co.kr | Spanish : Alldatasheet.es | French : Alldatasheet.fr | Italian : Alldatasheetit.com Portuguese : Alldatasheetpt.com | Polish : Alldatasheet.pl | Vietnamese : Alldatasheet.vn Indian : Alldatasheet.in | Mexican : Alldatasheet.com.mx | British : Alldatasheet.co.uk | New Zealand : Alldatasheet.co.nz |
|
Family Site : ic2ic.com |
icmetro.com |
 Chinese ▼
 English
 Chinese
 German
 Japanese
 Russian
 Korean
 Spanish
 French
 Italian
 Portuguese
 Polish
 Vietnamese
 Indian
 Mexican
 British
 New Zealand