|
数据搜索系统,热门电子元器件搜索 |
|
|
数据搜索系统,热门电子元器件搜索 |
|
AD9739-R2-EBZ 数据表(PDF) 43 Page - Analog Devices |
|
|
|||||||||||||||||||||||||||||
AD9739-R2-EBZ 数据表(HTML) 43 Page - Analog Devices |
|
|
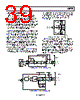
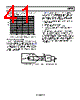
43 / 48 page  Data Sheet AD9739 Rev. B | Page 43 of 48 NONIDEAL SPECTRAL ARTIFACTS The AD9739 output spectrum contains spectral artifacts that are not part of the original digital input waveform. These non- ideal artifacts included harmonics (including alias harmonics), images, and clock spurs. Figure 71 shows a spectral plot of the AD9739 within the first Nyquist zone (that is, dc to fDAC/2) reconstructing a 650 MHz, 0 dBFS sine wave at 2.4 GSPS. Besides the desired fundamental tone at the −7.8 dBm level, the spectrum also reveals these nonideal artifacts that also appear as spurs above the measurement noise floor. Because these nonideal artifacts are also evident in the second and third Nyquist zones during mix mode operation, the effects of these artifacts should also be considered when selecting the DAC clock rate for a target RF band. –100 –90 –80 –70 –60 –50 –40 –30 –20 –10 0 0 200 400 600 800 1000 1200 FREQUENCY (MHz) HD3 HD5 HD9 HD6 HD4 FUND AT –7.6dBm fDAC/4 – fOUT fDAC/2 – fOUT fDAC/4 3/4 × fDAC/4 – fOUT HD2 Figure 71. Spectral Plot Note the following important observations pertaining to these nonideal spectral artifacts: 1. A full-scale sine wave (that is, single-tone) typically represents the worst-case condition because it has a peak-to-rms ratio of 3 dB and is unmodulated. Harmonics and aliased harmonics of a sine wave are easy to identify because they also appear as discrete spurs. Significant characterization of a high speed DAC is performed using single (or multitone) signals for this reason. 2. Modulated signals (that is, AM, PM, or FM) do not appear as spurs but rather as signals whose power spectral density is spread over a defined bandwidth determined by the modulation parameters of the signals. Any harmonics from the DAC spread over a wider bandwidth determined by the order of the harmonic and bandwidth of the modulated signal. For this reason, harmonics often appear as slight bumps in the measurement noise floor and can be difficult to discern. 3. Images appear as replicas of the original signal, therefore, can be easier to identify. In the case of the AD9739, internal modulation of the sampling clock at intervals related to fDAC/4 generate image pairs at ¼ × fDAC, ½ × fDAC, and ¾ × fDAC. Both upper and lower sideband images associated with ¼ × fDAC fall within the first Nyquist zone, while only the lower image of ½ × fDAC and ¾ × fDAC fall back. Note that the lower images appear frequency inverted. The difference in dBc between the fundamental and various images remains mostly signal independent because the mechanism causing these images is related to corruption of the sampling clock. 4. The magnitude of these images for a given device is dependent on several factors including DAC clock rate, output frequency, mu controller phase setting, and div-by-4 clock divider phase (Register 0x14, bit [7:6]. Table 30 shows how the magnitude of these images vary as the phase is varied for the case represented in Figure 71. Because the phase varies at power up, the image magnitude varies making it difficult to compensate digitally through a one-time factory calibration procedure. Also, the image magnitude can vary a few decibels over temperature and between devices due to process dependencies. (Note that the AD9739A is a viable option if factory calibration is considered acceptable for nonmultichip synchronization applications operating with clock rates in the 1.6 GSPS to 2.5 GSPS range). Table 30. Image Magnitude vs. Phase (PHZ) Setting Image location PHZ0 PHZ1 PHZ2 PHZ3 fDAC/4 − fOUT −70.2 −71.4 −72.2 −77.1 fDAC/2 − fOUT −80.2 −71.3 −69.9 −74.9 ¾ × fDAC − fOUT −69.9 −72.5 −73.4 −73.7 5. A clock spur appears at fDAC/4 and integer multiples of this frequency. Similar to images, the spur magnitude is also dependent on the same factors that cause variations in image levels. However, unlike images and harmonics, clock spurs always appear as discrete spurs, albeit their magnitude shows a slight dependency on the digital waveform and output frequency. Note that the clock spur appearing at fDAC/4 can also be factory calibrated. 6. A large clock spur also appears at 2 × fDAC in either normal or mix mode operation. This clock spur is due to the quad switch DAC architecture causing switching events to occur on both edges of fDAC. |
|
链接网址 |
| ALLDATASHEET是否为您带来帮助? [ DONATE ] |
关于 Alldatasheet | 广告服务 | 联系我们 | 隐私政策 | 数据表链接 | 链接交换 | 制造商名单 All Rights Reserved©Alldatasheet.com |
| Russian : Alldatasheetru.com | Korean : Alldatasheet.co.kr | Spanish : Alldatasheet.es | French : Alldatasheet.fr | Italian : Alldatasheetit.com Portuguese : Alldatasheetpt.com | Polish : Alldatasheet.pl | Vietnamese : Alldatasheet.vn Indian : Alldatasheet.in | Mexican : Alldatasheet.com.mx | British : Alldatasheet.co.uk | New Zealand : Alldatasheet.co.nz |
|
Family Site : ic2ic.com |
icmetro.com |
 Chinese ▼
 English
 Chinese
 German
 Japanese
 Russian
 Korean
 Spanish
 French
 Italian
 Portuguese
 Polish
 Vietnamese
 Indian
 Mexican
 British
 New Zealand